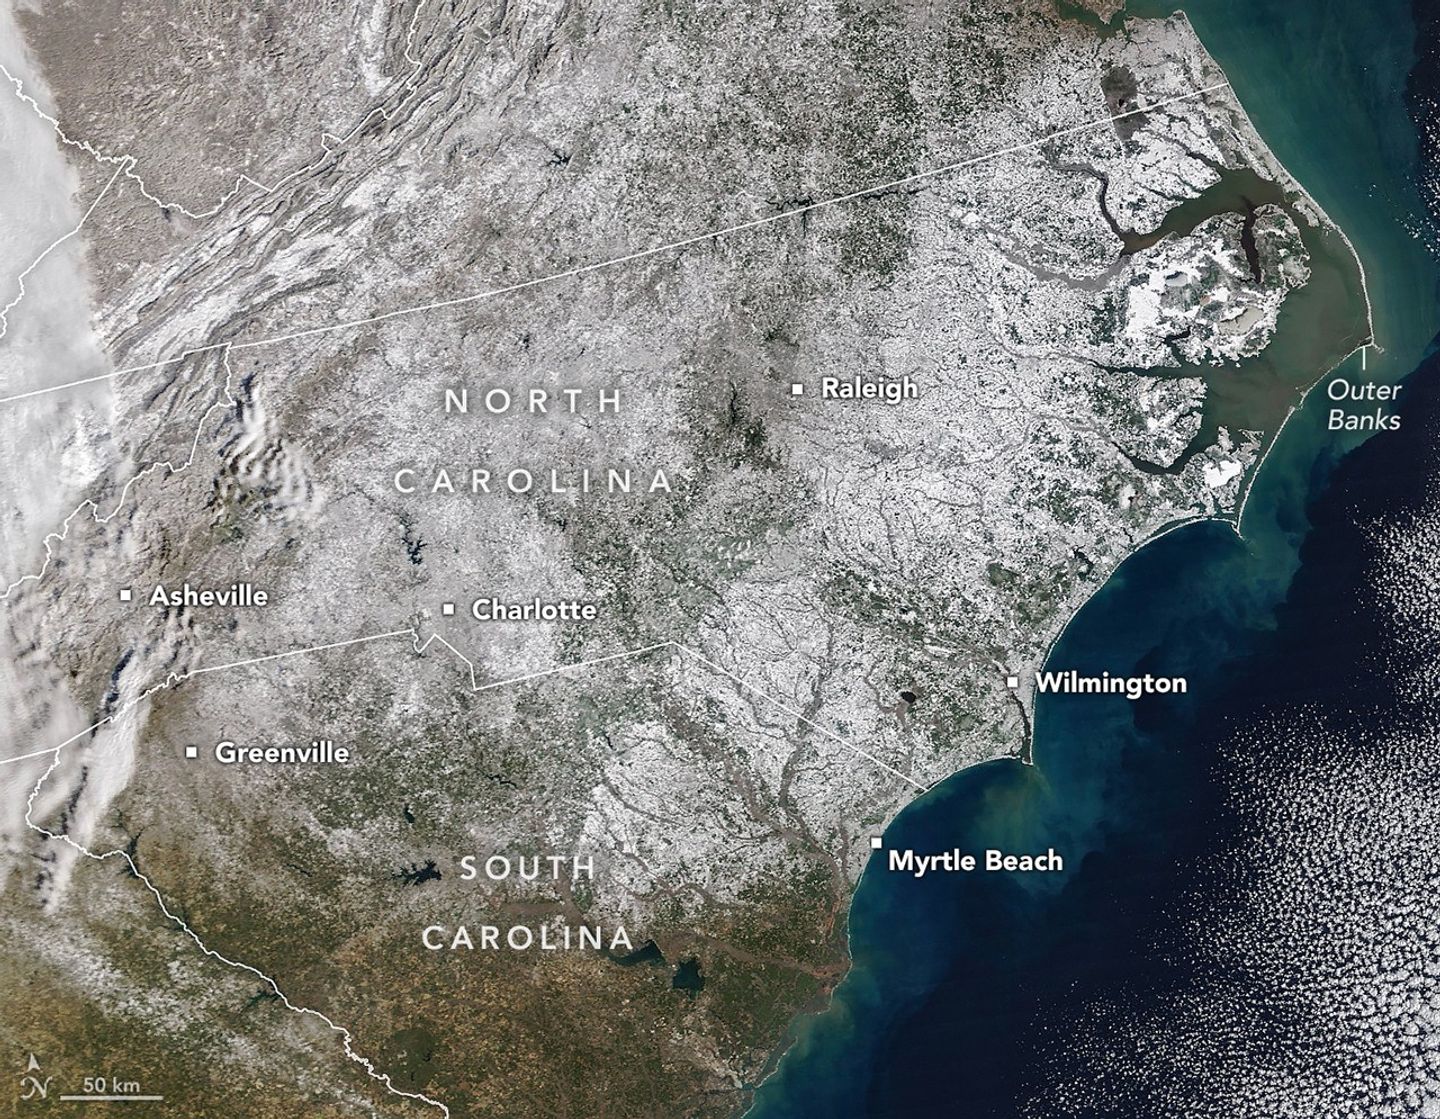
A potent winter storm in late January 2026 left much of North Carolina dealing with significant snow accumulations. Though the state is no stranger to snow, such widespread coverage is unusual.
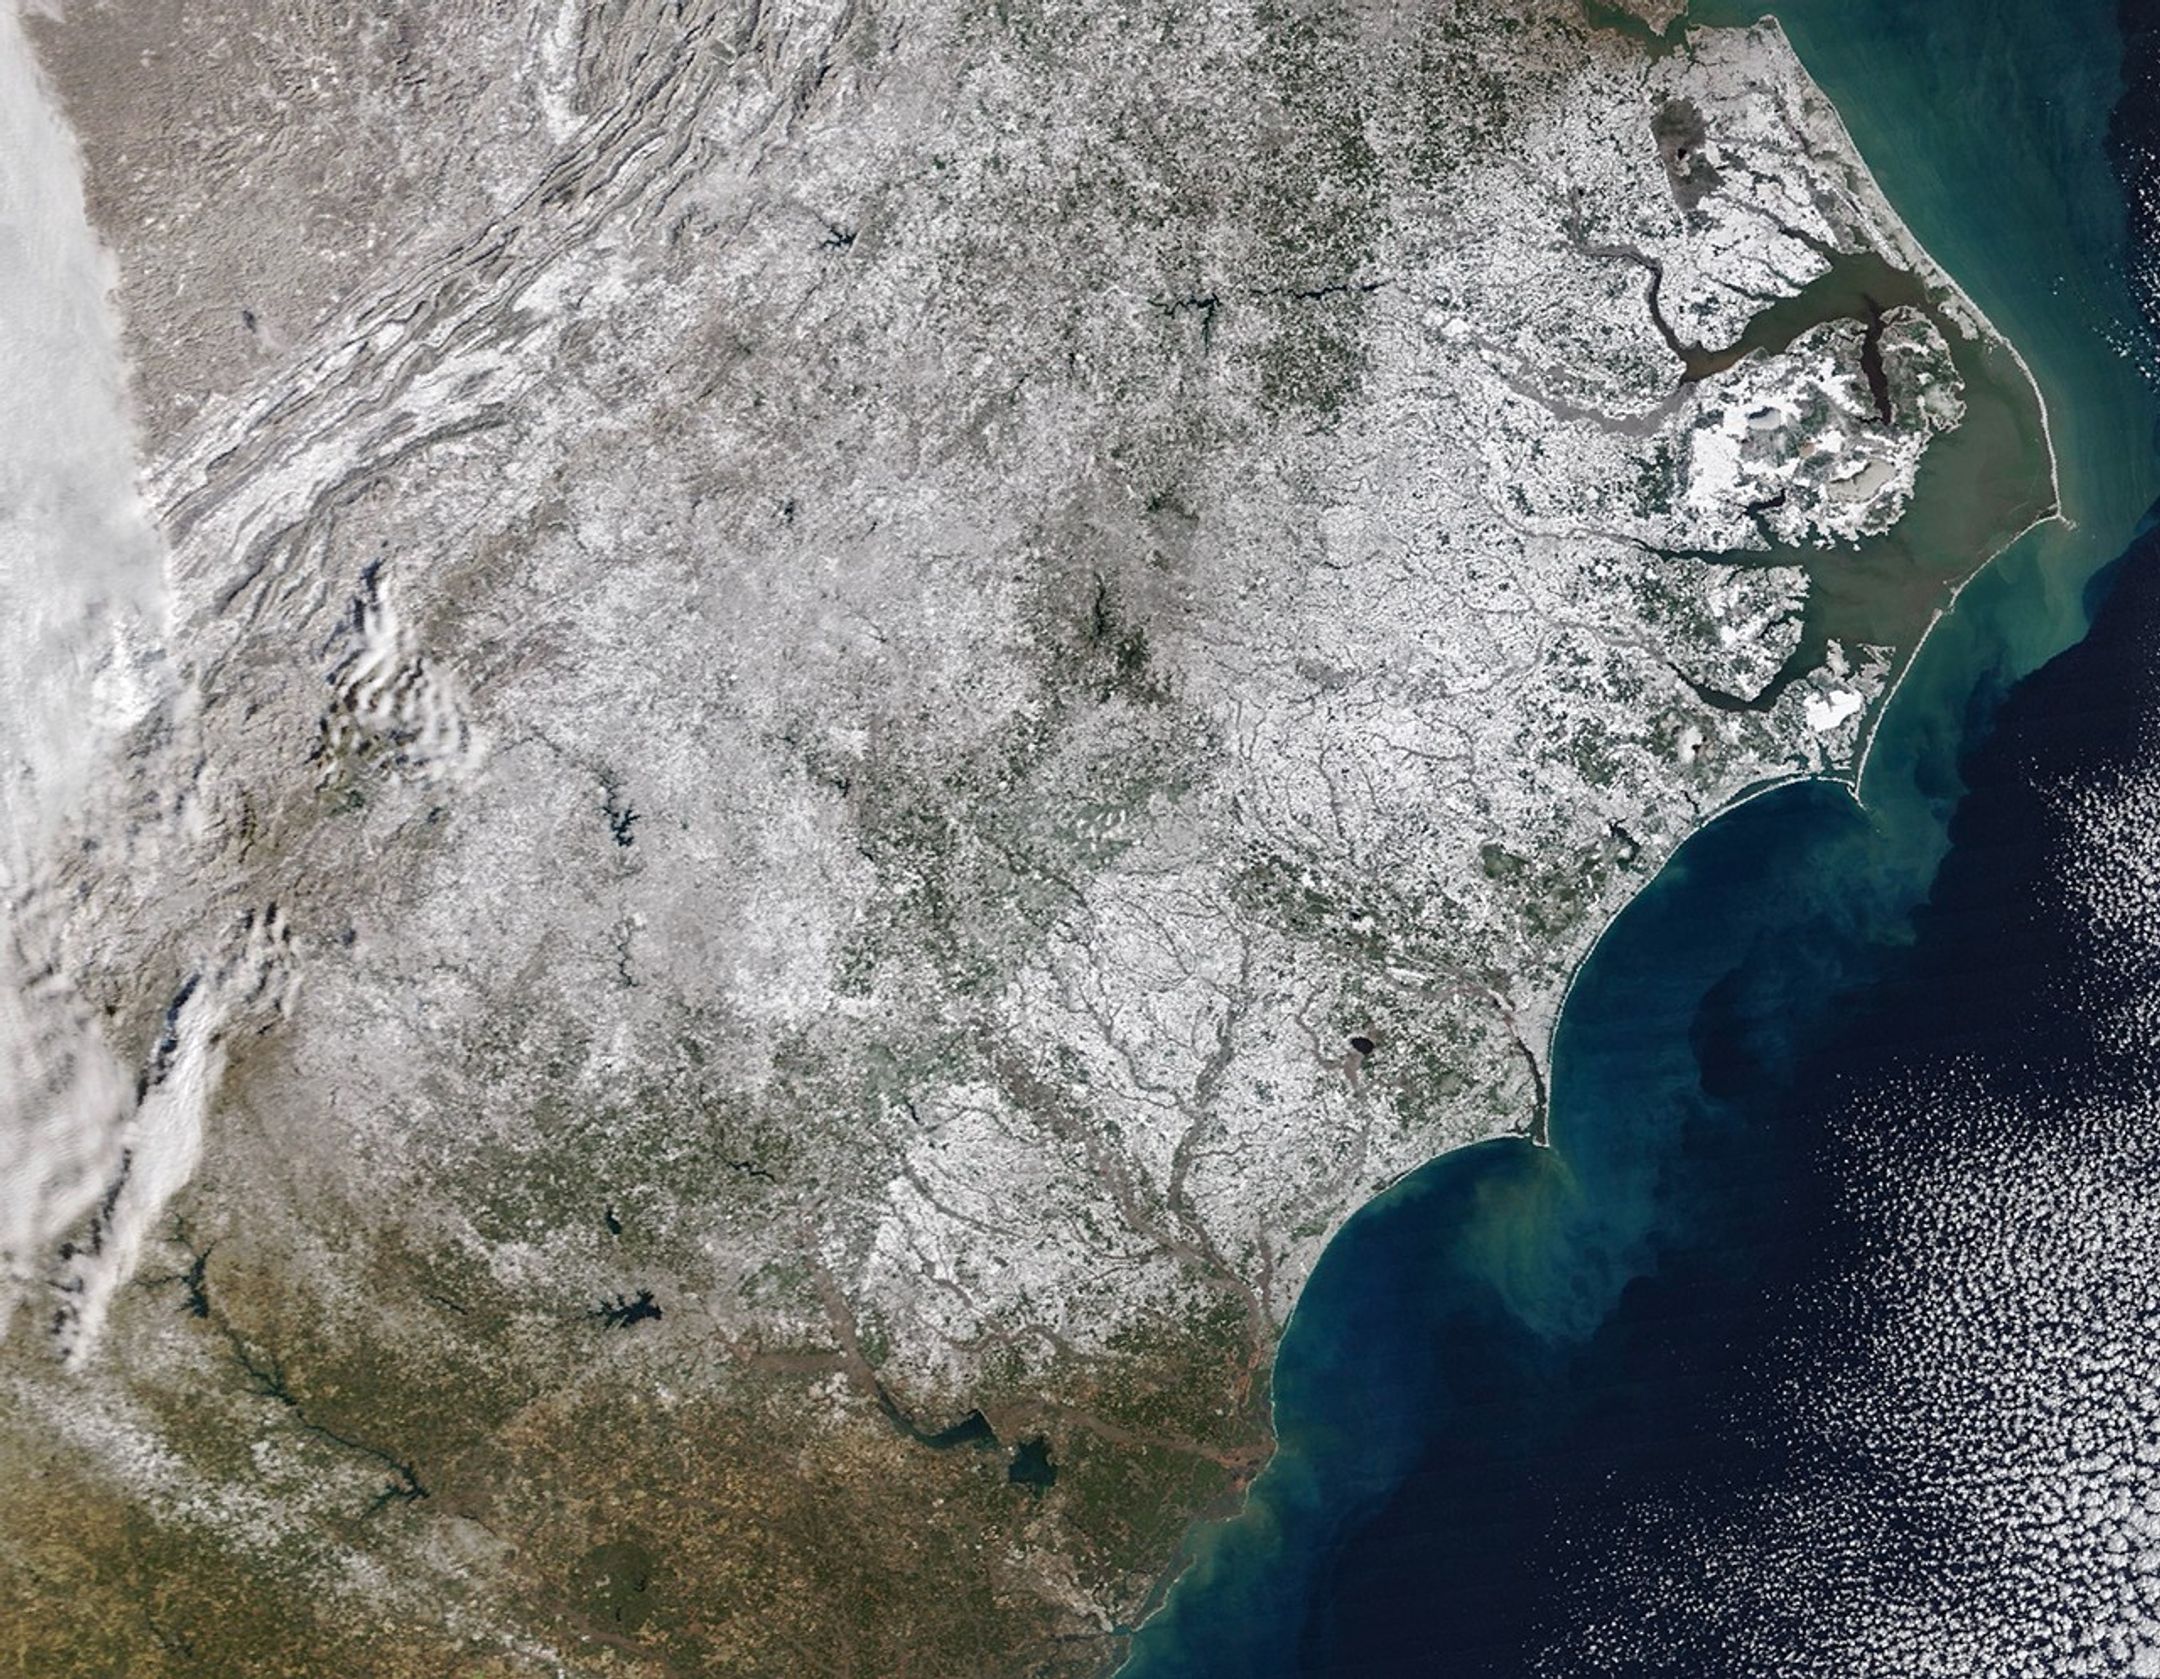
This image, acquired on February 2 with the MODIS (Moderate Resolution Imaging Spectroradiometer) on NASA’s Terra satellite, reveals a nearly continuous blanket of white stretching from mountain cities in the west to beachfront towns in the east. According to the North Carolina State Climate Office, measurable snow fell in all 100 counties for the first time in more than a decade.
Snowfall in North Carolina typically requires cold air funneled in from the north to combine with moisture supplied by a low-pressure system. During the January 31 weekend event, Arctic air from earlier in the week lingered across the state as a storm approached along a near-shore track, setting the stage for widespread snow.
Snow totals exceeded a foot in some of the state’s western, mountainous regions, following several years without significant snowfall events, though some locations such as Asheville saw smaller amounts. The storm even pushed south into Greenville, South Carolina, in the foothills of the Blue Ridge Mountains, where the downtown area saw about 5 inches (13 centimeters) by the evening of January 31, according to the National Weather Service.
In the Piedmont region, the hilly central part of the state, Charlotte received nearly a foot of snow—the most since 2004—while Raleigh saw a lighter accumulation of 2.8 inches, according to the state climate center.
February 2, 2026
Even coastal parts of the state traded brown sandy beaches for a blanket of white, with more than a foot reported in parts of Carteret County. Beaufort, a mainland town in the southern Outer Banks area, experienced heavy blowing snow. Slightly inland, Greenville received 14 inches, an amount not seen since a large storm in March 1980.
Though appearing serene from space, the storm posed real hazards on the ground. Dangerous road conditions snarled traffic and caused collisions, according to local news reports, while coastal areas saw high winds and waves. Overwash on Highway 12 in the Outer Banks coated parts of the road in standing water and sand, while several homes along the shore of Hatteras Island collapsed into the sea.
NASA Earth Observatory images by Michala Garrison, using MODIS data from NASA EOSDIS LANCE and GIBS/Worldview. Story by Kathryn Hansen.
2025 was a busy year for AO3! The site continued to see rising traffic, with Communicationspublishing an update on AO3 statistics from 2020-2025. In December, Support received 3,589 tickets, totalling to over 40,000 tickets received in 2025, an all-time high. Meanwhile, Policy & Abuse (PAC) received 6,357 tickets in December, totalling approximately 47,500 tickets in 2025. Check out PAC's pie chart for more details.
Pie chart of the approximately 47,500 Policy & Abuse tickets submitted in 2025, divided by type of complaint. These categories reflect the subject of the complaint, and (with the exception of Offensive Content), do not indicate whether the report was upheld or rejected.
In the first half of January, User Response Translation translated or betaed 32 ticket requests from Support and PAC.
In December, Tag Wrangling wrangled approximately 598,000 tags, or around 1,300 tags per volunteer. In total, they wrangled approximately 4,944,000 tags in 2025. They also continued work on handling "No Fandom" additional tags, publishing December and January news posts detailing recent changes. In total, Tag Wrangling published nine "No Fandom"-related news posts in 2025 covering around 399 new canonical "No Fandom" additional tags.
In January, Tag Wrangling updated their Fandom Tag Metatag guidelines, including clarifying when a fandom metatag should be made and when to merge closely related fandoms into one fandom tag. Check out the news post detailing the new policy.
As part of International Volunteers Day (IVD) 2025, Communications collected and batched answers to the IVD Q&A by committee, resulting in five committee-specific news posts highlighting Communications, Support, Tag Wrangling, Translation, and Volunteers & Recruiting. Answers across committees, along with additional responses not featured in the news posts, have been compiled in a separate AO3 work.
III. ELSEWHERE AT THE OTW
Fanlore ran an editing chat to close out 2025, and it was a lot of fun! They also began preparing for their annual IFD Fanlore Challenge and Femslash February event! Keep an eye on their Bluesky, Twitter/X, and Tumblr for announcements.
Legal answered many internal and external questions this month.
In January, Communications' Fanhackers wrote about the Transformative Approaches to Fan Identity, and they began a multi-post survey of acafannish research and publishing resources.
IV. GOVERNANCE
In December, Board announced the resignations of two directors: Kathryn Solderholm and Erica Frank. We would like to thank Erica and Kathryn for their service as members of the Board, and wish them all the best in their future endeavours with the OTW.
In January, Board finalized and approved the OTW Procurement & Purchasing Policy. They and the Board Assistants Team (BAT) organised the first quarter of 2026 public Board meeting on January 18 which had 54 attendees. Minutes of this meeting will be available soon on the OTW website. Elsewhere, Board and BAT continued work on document review and archiving board statements, Code of Conduct tasks in conjunction with Organizational Culture Roadmap, and ongoing projects for mental health resources for volunteers, scheduling tools, public meeting best practices and volunteer retention in BAT. BAT also updated their OTW website committee page.
Organizational Culture Roadmap finalized a confidentiality policy in preparation for upcoming external recruitment.
V. OUR VOLUNTEERS
In December, Volunteers & Recruiting thanked all OTW volunteers on International Volunteer Day with their organization-wide email and graphics campaign. In January, they ran recruitment for Open Doors.
From November 22 to January 23, Volunteers & Recruiting received 355 new requests, and completed 378, leaving them with 52 open requests (including induction and removal tasks listed below). As of January 23, 2025, the OTW has 1,013 volunteers. \o/ Recent personnel movements are listed below.
New Subcommittee Leads/Workgroup Heads: Eevee (Internal Complaint and Conflict Resolution Lead) and megidola (Organizational Culture Roadmap Workgroup Head) New AO3 Documentation Volunteers: Lulu S (Chair Trainee) New Fanlore Volunteers: Elfie, Konsta Morales, Watts, and 1 other Graphic Designer New Open Doors Volunteers: Addiebees, AviLine, feelyx, LeighR, Marie K, meservey66, MetaKass, miffmiff, Mort, pinkconstellations, SleepyJane, Spit, StormySea, Truendz, Vail, and 11 other Import Assistants New Policy & Abuse Volunteers: megidola (Supervisor) and 1 Chair Track Volunteer New Tag Wrangling Volunteers: Chelsea Cheyanne, inspiredstork, Sanity, will, and Yrindor (Supervisors) New Translation Volunteers: Rhine and 1 other Chair Trainee; Arushi, athursdayschild, Eirinar, Linarii, Mira8, Niki K, Phoebe B, Pi, Rita P, and 12 other Translators New TWC Volunteers: Fiona M, Yumi, and 3 other Layout Editors; and 2 Outreach and Communications Editors New User Response Translation Volunteers: Eki, f0f8ff, HARRitte, Jules R, Laus, PanPan, rosings, zoy zauce, and 3 other Translators
Departing Directors: Erica Frank and Kathryn Soderholm Departing Committee Chairs: 1 Communications Chair and 1 Elections Chair Departing BAT Volunteers: 1 Volunteer Departing Communications Volunteers: KW Ukuku (TikTok Moderator), Lori P (Graphics Volunteer), 1 Fanhacker Volunteer, and 1 Social Media Moderator Departing Communications News Post Moderation Volunteers: 1 News Post Moderator Departing Development & Membership Volunteers: 1 Graphic Designer, 2 Membership Data Specialists, and 2 Volunteers Departing Fanlore Volunteers: 1 Discord Moderator, 1 Outreach Analyst, and 1 Policy & Admin Departing Open Doors Volunteers: Pelagia and 1 other Administrative Volunteer, Wynne (Import Assistant), and 1 FCPP Intern Departing Policy & Abuse Volunteers: 1 Volunteer Departing Strategic Planning Volunteers: 1 Volunteer Departing Support Volunteers: Nary and 22 other Volunteers Departing Tag Wrangling Volunteers: Nary and 1 other Supervisor; Asas Carmesins, Bruno, Eevee, lianneder, Lily_Haydee_Lohdisse, McBangle, Sayornis, Tea Huimyni, and 10 other Wranglers Departing Translation Volunteers: Teelee (Task Assistant); Illiterations and 4 Translators Departing TWC Volunteers: Melanie Kohnen (Review Editor); Courtney Lazore and 1 other Proofreader; and 1 Symposium Editor Departing User Response Translation Volunteers: 1 Translator Departing Volunteers & Recruiting Volunteers: 1 Senior Volunteer and 2 Volunteers
For more information about our committees and their regular activities, you can refer to the committee pages on our website.
The Organization for Transformative Works is the non-profit parent organization of multiple projects including Archive of Our Own, Fanlore, Open Doors, OTW Legal Advocacy, and Transformative Works and Cultures. We are a fan-run, donor-supported organization staffed by volunteers. Find out more about us on our website.
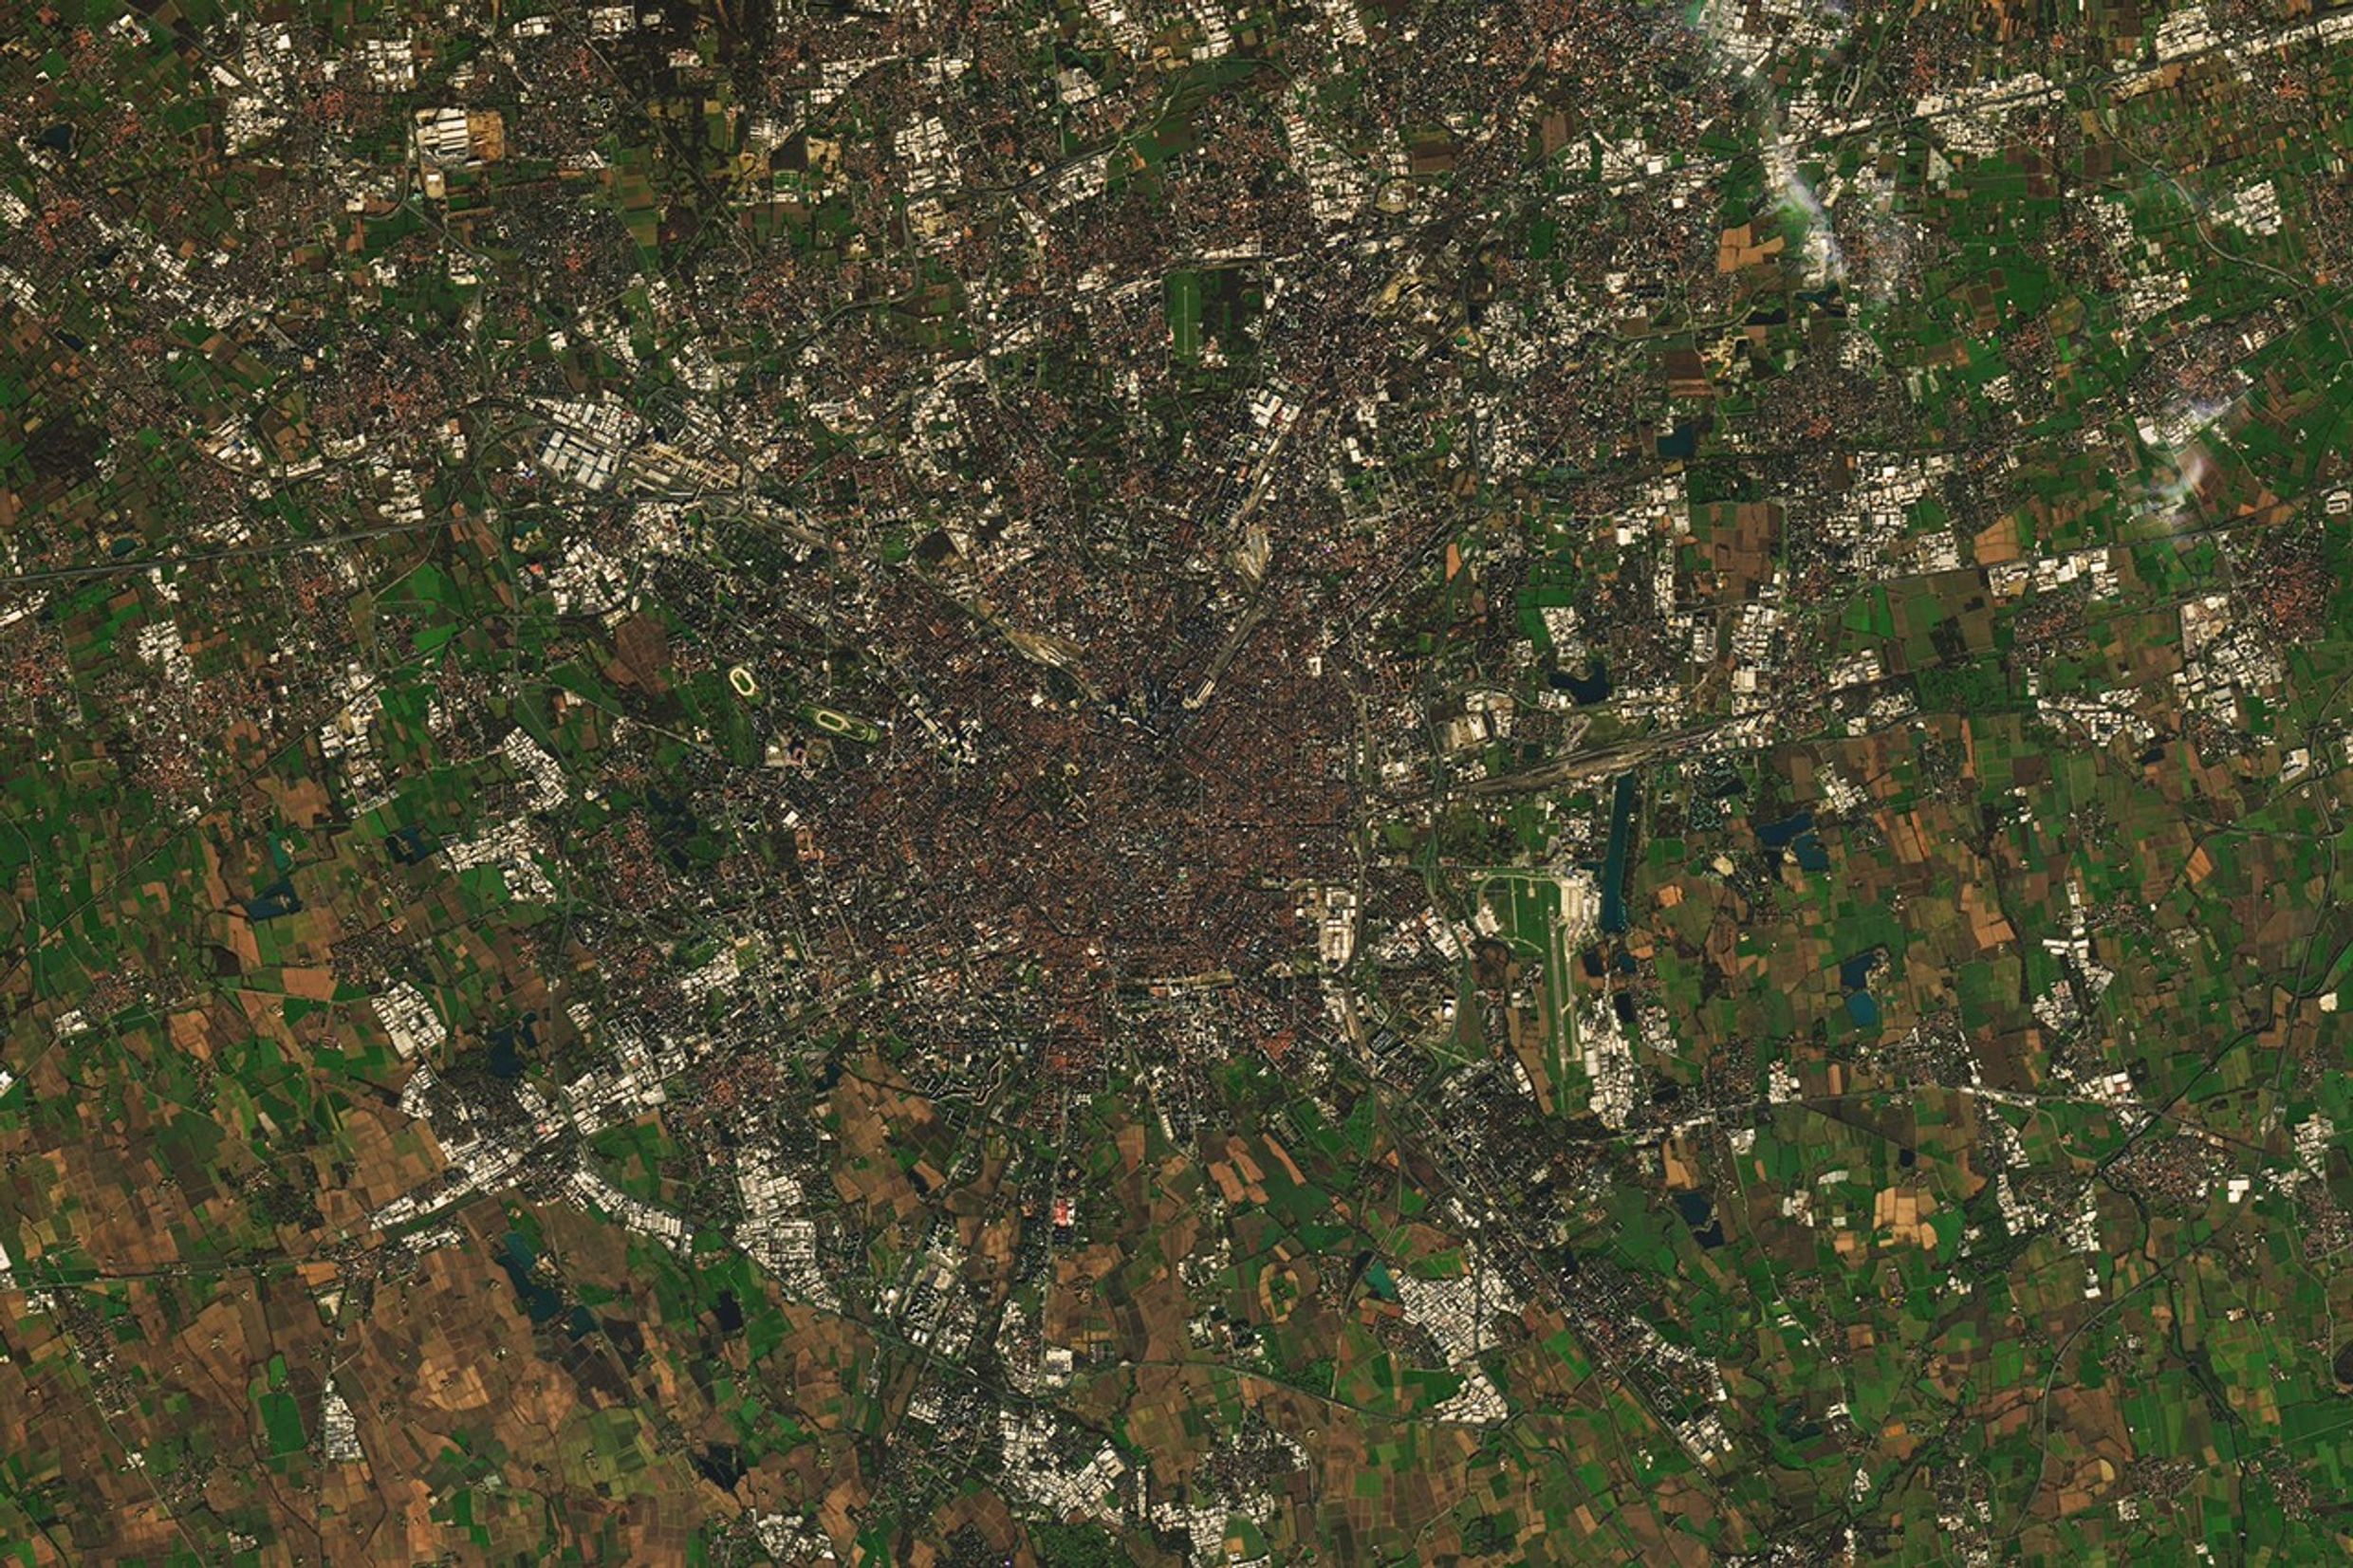
No Olympic competitions covers more ground than the 50-kilometer cross-country ski races. The grueling event takes more than 2 hours to complete, requiring competitors to ski a distance longer than a marathon. That’s still, however, less than an eighth of the distance between the two official host cities of the 2026 Winter Olympics and Paralympics—Milan and Cortina d’Ampezzo.
With events spread across more than 22,000 square kilometers (8,500 square miles) and eight cities or towns in northern Italy, these are the most geographically dispersed Games in Olympic history. The decentralized design was intentional, allowing planners to control costs and make the event more sustainable by using existing venues rather than constructing several expensive new facilities. More than 90 percent of the venues are existing or temporary facilities, including some refurbished facilities that were used in the 1956 Cortina d’Ampezzo Games.
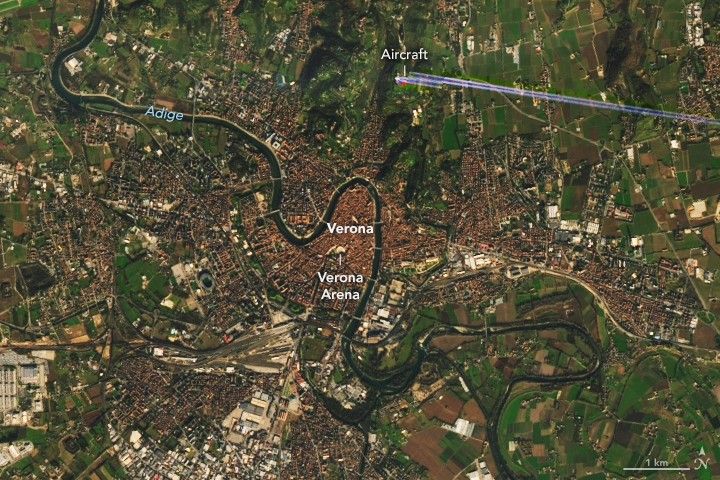
About 2,900 athletes will compete across 116 events over 19 days in 13 venues in what will be the third time Italy has hosted the Games. Several of the key event venues are visible in these satellite images of the two largest host cities—Milan and Verona. The OLI (Operational Land Imager) on Landsat 8 and 9 captured the images on December 8 and 9, 2025, respectively.
Olympic festivities will kick off officially on February 6 at San Siro Stadium with performances by pop star Mariah Carey, classical singer Andrea Bocelli, classical instrumentalist Lang Lang, and Italian singer-songwriter Laura Pausini. Built in 1925, San Siro is Italy’s largest stadium and the longtime home of renowned football clubs AC Milan and Inter Milan.
December 9, 2025
Milan will mostly host indoor ice events in several other venues around the city. Ice hockeywill be spread across two venues, the Milano Santagiulia Ice Hockey Arena and the temporary Milano Rho Ice Hockey Arena. The former, located east of the city in the green and residential Santa Giulia district, is the only new permanent venue constructed for the Games. The latter, in Milano Ice Park, is a temporary transformation of the Fiera Milano Rho exhibition center, a complex of pavilions and a convention center northwest of the city center.
Speed skating and figure skating will be in the Milano Ice Skating Arena, an 11,500-person stadium in Assago, a small town just outside of Milan. Outside of the Olympics, the multisport facility is used by a skating school and basketball team and as a venue for tennis, squash, swimming, and several other sports.
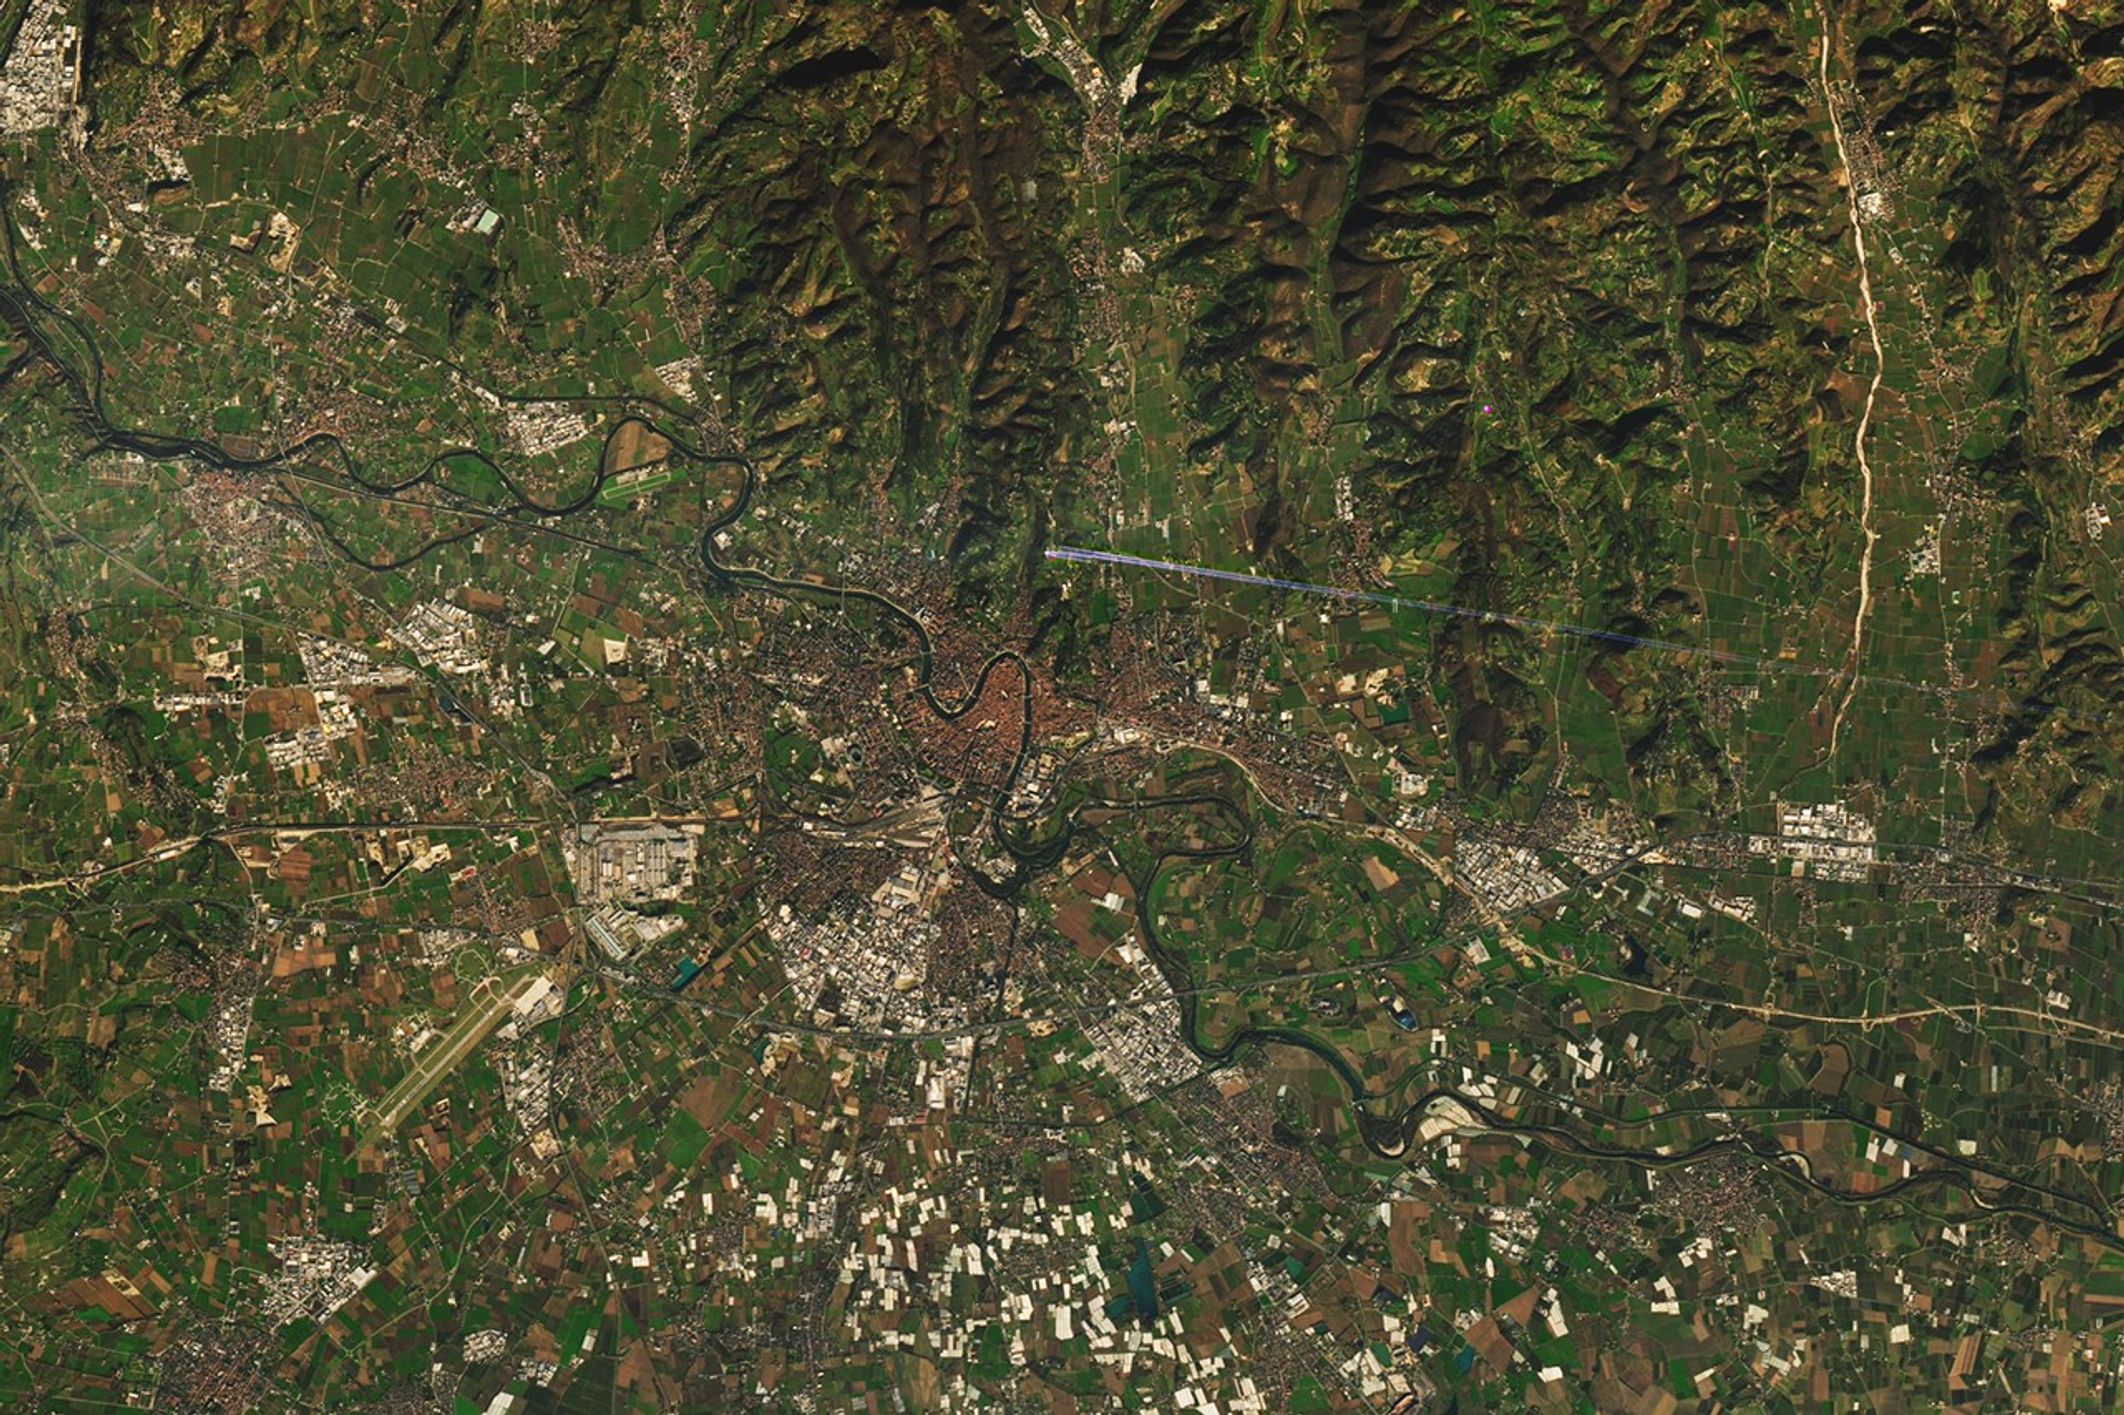
The February 22 closing ceremonies will take place in Verona, a city of about 250,000 people 150 kilometers east of Milan, in Verona Arena, an ancient Roman amphitheater that was built between the 1st and 3rd centuries. What was once used for animal hunts and gladiator battles will serve as the backdrop for musicians, dancers, and artists in a ceremony that organizers say will honor the spirit of athletics and Italy’s rich cultural heritage. The arena, with a seating capacity of about 22,000, is the third-largest surviving amphitheater in Europe and unusually well-preserved.
New events this year will include men’s and women’s ski mountaineering, skeleton mixed team relay, women’s doubles luge, freestyle skiing dual moguls, and women’s large hill ski jumping. The 2026 Olympic mascots are Tina and Milo, a brother-and-sister pair of cheerful, scarf-wearing animated stoats with names inspired by Milan and Cortina. Stoats, also called ermine, are fierce predators in the weasel family known for reportedly mesmerizing prey with energetic dances and for having fur that changes from dark brown in the summer to white in the winter. In Italy, stoats typically live in the mountains above 3,500 meters (11,500 feet).
NASA Earth Observatory image by Lauren Dauphin, using Landsat data from the U.S. Geological Survey. Story by Adam Voiland.
These observations by NASA’s SPHEREx (Spectro-Photometer for the History of the Universe, Epoch of Reionization and Ices Explorer) show the infrared light emitted by the dust, water, organic molecules, and carbon dioxide contained within comet 3I/ATLAS’s coma. The comet brightened significantly during the December 2025 period when SPHEREx made the observations — about two months after the icy body had passed its closest distance to the Sun in late October.
The space telescope has the singular capability of seeing the sky in 102 colors, each representing a wavelength of infrared light that provides unique information about galaxies, stars, planet-forming regions, or other cosmic features, including the various gases and dust seen in the coma of 3I/ATLAS. The information gathered by SPHEREx helps scientists better understand what materials 3I/ATLAS contains and how the interstellar object’s pristine ices react to the Sun’s heating as the comet journeys through the solar system.
The mission is managed by NASA’s Jet Propulsion Laboratory in Southern California for the agency’s Astrophysics Division within the Science Mission Directorate in Washington. The telescope and the spacecraft bus were built by BAE Systems. The science analysis of the SPHEREx data is being conducted by a team of scientists at 13 institutions across the U.S., and in South Korea and Taiwan, led by Principal Investigator Jamie Bock, based at Caltech with a joint JPL appointment, and by JPL Project Scientist Olivier Dore. Data is processed and archived at IPAC at Caltech in Pasadena, which manages JPL for NASA. The SPHEREx dataset is freely available to scientists and the public.
The New York metropolitan area was showing the effects of a prolonged cold spell in late January 2026. During a stretch of frigid weather, ice choked the Hudson River along Manhattan’s western shore.
The OLI (Operational Land Imager) on Landsat 8 captured this image of the wintry landscape around midday on January 28. The image is false-color (bands 5-4-3) to distinguish ice (light blue) from open water and snow. Vegetation appears red. Ice is abundant in the Hudson River and visible in smaller amounts in the East River, the Jacqueline Kennedy Onassis Reservoir in Central Park, and waterways in New Jersey.
Temperatures in New York City dropped below freezing on January 24 and stayed there for over a week. The high on January 28, the date of the image, was 23 degrees Fahrenheit (minus 5 degrees Celsius). Low temperatures and harsh wind chills gripped much of eastern North America over this period amid a surge of Arctic air.
Much of the ice in the image likely floated there from farther upriver, where tidal currents are weaker and salinity is lower. These conditions allow water to freeze sooner and at higher temperatures than the faster-flowing, brackish water near the river’s mouth, shown here. A complete freeze of the Hudson around Manhattan is unlikely, experts say, although it did occur back in 1888. Still, the ice buildup was substantial enough for NYC Ferry to suspend services for several days.
Iced-up rivers can have other implications, from flooding and infrastructure damage to changes in hydrologic processes that affect water quality and aquatic habitats.
Scientists, government agencies, and emergency responders are increasingly turning to remote sensing technologies such as synthetic aperture radar and hyperspectral imaging to track river ice. Improved monitoring can aid in water resource management and mitigate ice’s effects on infrastructure and ecosystems.
In addition to the river ice, other signs of winter were visible across New York. A fresh layer of snow coated the landscape following a winter storm, in which a weather station in Central Park recorded nearly 12 inches (30 centimeters) of accumulation on January 25. And the low angle of the midwinter Sun caused the tall buildings in Midtown and Lower Manhattan to cast long shadows.
In a neighboring borough on February 2, a shorter shadow was cast—this one by the weather-prognosticating groundhog known as Staten Island Chuck. Folklore holds that the sighting signals six more weeks of winter. When compared with data from NOAA’s National Centers for Environmental Information, the New York rodent was deemed the most accurate of his peer weather “forecasters.” This year, Chuck might be right, at least in the near term: the National Weather Service forecast called for below-average temperatures to persist, with Arctic air returning to the city by the weekend.
NASA Earth Observatory image by Michala Garrison, using Landsat data from the U.S. Geological Survey. Story by Lindsey Doermann.
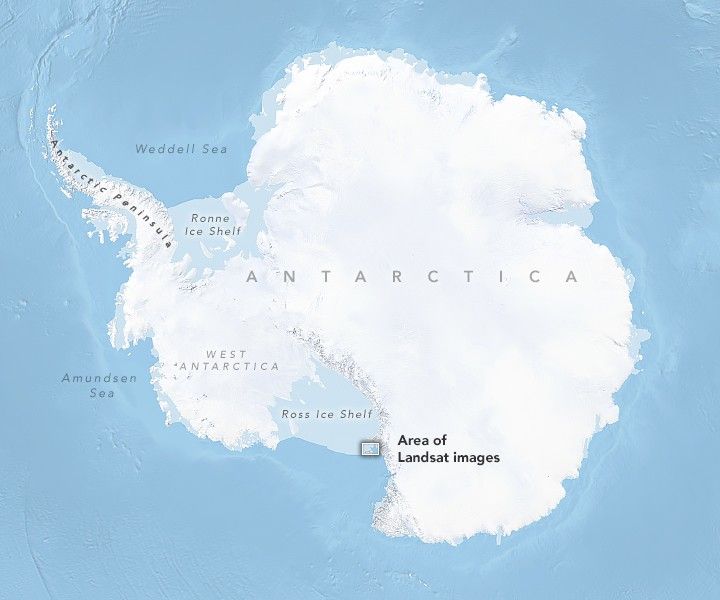
‘Tis the season for long and ruler-straight cracks in McMurdo Sound’s sea ice. Though natural breaks in sea ice are called leads, the better term for the human-made fracture seen in these satellite images is a ship channel.
In the austral summer, usually in January, an icebreaker rams a path through the fast ice—a type of sea ice that is anchored to the shore—that often covers McMurdo Sound. This annual effort allows cargo ships to reach McMurdo Station, a research base operated by the United States Antarctic Program. The U.S. Coast Guard Cutter Polar Star completed the task in January 2026, arriving after breaking a path through several miles of ice between the Ross Sea and an ice pier at McMurdo. Most of the channel was cut between January 19 and 20.
January 2 – January 27, 2026
The animation above, made of images captured by the OLI (Operational Land Imager) on Landsat 8 and 9, offers satellite views of the icebreaker’s work. Images were captured on January 2, 7, 19, 20, 23, 25, and 27. The nearly 120-meter (400-foot) vessel weighs 13,500 tons and has thick steel-plated hulls. With 75,000 shaft horsepower, it’s the world’s most powerful non-nuclear icebreaker.
The ship sometimes conducts search-and-rescue missions as well. On January 17, the day marking its 50th year of service, the Polar Star responded to a call from an Australian cruise ship in the Ross Sea hampered by thick, pack ice—a type of sea ice unattached to the shoreline that drifts. After making two close passes to break up the ice and clear a path, the Polar Star escorted the cruise ship 4 nautical miles (7 kilometers) to open water in the Ross Sea, according to the U.S. Coast Guard.
Established in 1955, McMurdo Station is the southernmost point on Earth accessible by ship. With a population that swells to 1,200 in the summer, it is the largest research station in Antarctica, hosting a harbor, two airfields, and a helicopter pad. Though once powered by a portable nuclear reactor known as “Nukey Poo,” the base now runs on energy from diesel electric generators and a wind farm on Crater Hill.
With the ship passage open, McMurdo Station is slated to receive two large deliveries this summer. The Stena Polaris, a tanker, arrived on January 20 with 5 million gallons of diesel fuel. Plantijngracht, a cargo ship, will arrive later with food, supplies, and parts of a new floating pier that will replace the traditional ice pier that military engineers have constructed each winter to give ships somewhere to unload cargo.
The U.S. National Science Foundation manages McMurdo Station and much of the science conducted there. NASA has also been involved in several projects at the base over the years. For instance, NASA’s McMurdo Ground Station, a Near Space Network facility, is used to download data from polar-orbiting satellites such as Landsat 9 and SMAP. The agency also flew its Operation Ice Bridge airborne campaign from McMurdo in 2013 and regularly launches research balloons from the station as part of its scientific ballooning program.
The Polar Star typically remains at McMurdo through March to keep the ship passage clear and returns to its home port of Seattle in April.
NASA Earth Observatory images by Michala Garrison, using Landsat data from the U.S. Geological Survey.Story by Adam Voiland.
Downloads
January 2, 2026
JPEG (347.10 KB)
January 7, 2026
JPEG (371.12 KB)
January 19, 2026
JPEG (396.28 KB)
January 20, 2026
JPEG (406.54 KB)
January 23, 2026
JPEG (390.37 KB)
January 25, 2026
JPEG (426.85 KB)
References & Resources
Atlas Obscura (2024, March 20) McMurdo Ice Pier. Accessed February 2, 2026.
AO3 Tag Wranglers continue to test processes for wrangling canonical additional tags (tags that appear in the auto-complete) which don't belong to any particular fandom (also known as "No Fandom" tags). This post overviews some of these upcoming changes.
In this round of updates, we began adjusting existing canonical "No Fandom" tags to add or remove new subtag and metatag relationships. We also continued to streamline creating new canonical tags, prioritizing more straightforward updates which would have less discussion compared to renaming current canonical tags or creating new canonical tags which touch on more complex topics. This method also reviews new tags on a regular basis, so check back on AO3 News for periodic "No Fandom" tag announcements.
None of these updates change the tags users have added to works. If a user-created tag is considered to have the same meaning as a new canonical, it will be made a synonym of one of these newly created canonical tags, and works with that user-created tag will appear when the canonical tag is selected.
In short, these changes only affect which tags appear in AO3's auto-complete and filters. You can and should continue to tag your works however you prefer.
New Canonicals
The following concepts have been made new canonical tags:
Additionally, this month we began making adjustments to existing canonical tags to add or remove new subtag and metatag relationships, which help users find related content and filter in/out content as they browse works on AO3.
While some of these tags may be tags and concepts you're intimately familiar with, others may be concepts you've never heard of before. Fortunately, our fellow OTW volunteers at Fanlore may be able to help! As you may have seen in the comments sections of previous posts, Fanlore is a fantastic resource for learning more about these common fandom concepts, and about the history and lore of fandom in general. For the curious, here's a quick look at a few articles about concepts related to this month's new canonical tags:
While we won't be announcing every change we make to No Fandom canonical tags, you can expect similar updates in the future about tags we believe will most affect users. If you're interested in the changes we'll be making, you can continue to check AO3 News or follow us on Bluesky @wranglers.archiveofourown.org or Tumblr @ao3org for future announcements.
You can also read previous updates on "No Fandom" tags as well as other wrangling updates, linked below:
For more information about AO3's tag system, check out our Tags FAQ.
In addition to providing technical help, AO3 Support also handles requests related to how tags are sorted and connected. If you have questions about specific tags, which were first used over a month ago and are unrelated to any of the new canonical tags listed above, please contact Support instead of leaving a comment on this post.
Please keep in mind that discussions about what tags to canonize and what format they should take are ongoing. As a result, not all related concepts will be canonized at the same time. This does not mean that related or similar concepts will not be canonized in the future or that we have chosen to canonize one specific concept in lieu of another, simply that we likely either haven’t gotten to that related concept yet or that it needs further discussion and will take a bit longer for us to canonize it as a result. We appreciate your patience and understanding.
Lastly, we're still working on implementing changes and connecting relevant user-created tags to these new canonicals, so it’ll be some time before these updates are complete. If you have questions about specific tags which should be connected to these new canonicals, please refrain from contacting Support about them until at least three months from now to give us adequate time to do so.
The Organization for Transformative Works is the non-profit parent organization of multiple projects including Archive of Our Own, Fanlore, Open Doors, OTW Legal Advocacy, and Transformative Works and Cultures. We are a fan-run, donor-supported organization staffed by volunteers. Find out more about us on our website.
As the seasons sweep through southwest Virginia, the lush summer landscape transforms, fading into fall and winter.
From October 4 to December 6, 2025, the forests in this animation turn from green to orange to brown before being blanketed by white snow. The animation is composed of images from Harmonized Landsat and Sentinel-2 (HLS), a NASA product that combines imagery from the NASA/USGS Landsat 8 and Landsat 9 satellites and the European Space Agency’s Sentinel-2A, 2B, and 2C satellites.
The animation showcases the Valley and Ridge province of the Appalachian Mountains, named for its characteristic parallel ridges and valleys. When the supercontinent Pangea formed, the region was compressed, one of the factors producing this folded landscape.
The region’s forests, largely deciduous, undergo color change in the fall before shedding their leaves. Certain species change color earlier, while others lose their green pigment later in the season. Because of Virginia’s rich tree diversity—nearly 100 species of deciduous trees are native to the state—the landscape becomes a patchwork of shifting colors.
December 6, 2025
Paige Williams, an assistant professor in the School of Life Sciences and Sustainability at Virginia Commonwealth University, identified several notable landscape changes captured in the video. Price Mountain, with nearly entirely deciduous forests, appears bright orange in early November and then fades to brown by mid-month.
Northeast of Price Mountain, Blacksburg—home of Virginia Tech—maintains a backdrop of green and gray. Ellet Valley, east of town, stays green until early December, long after surrounding ridgelines fade to brown, due to irrigated agricultural fields, cattle grazing, and golf courses. Evergreens, which retain their foliage year-round, dot the scene with dark green and thrive most on north-facing slopes.
Nearly 80 percent of Virginia’s forests are deciduous or a mix of deciduous and pine trees. Deciduous trees lose their leaves every fall in a process called senescence. As days get shorter and temperatures drop, chlorophyll (which gives leaves their green color) begins to break down, revealing other carotenoid plant pigments, usually yellow and orange hues hidden during the spring and summer. Some trees produce new pigments that turn leaves red. Before the leaves fall, the trees absorb as many of their nutrients as possible, recycling them for future growth.
In early December, a rare early-season snowstorm visited Virginia. Snow covered the landscape, sliding off steeper slopes and collecting in valleys and flatlands. The National Weather Service reported that by the month’s end, Blacksburg had collected a total of 8.6 inches (22 centimeters) of snow—nearly 4 inches more than the 1991–2020 average for December.
Animation by Ross Walter/Landsat Science Office Support, using data from the Harmonized Landsat and Sentinel-2 (HLS) product. Still image by Lauren Dauphin/NASA Earth Observatory using Landsat data from the U.S. Geological Survey. Story by Madeleine Gregory/Landsat Project Science Support.
Last November we asked the community to submit questions to our OTW volunteers in celebration of International Volunteer Day. In this series of posts we will spotlight some of our committees' responses.
The Communications committee (Comms) disseminates information to the general public, media, and fans. We draft and beta news posts and social media posts, and are often the first point of contact for anyone interested in the OTW.
We asked Comms for replies to your questions, and received a lot of feedback! Below you can find a selection of their answers:
Communications Committee Specific Questions
Question: We're so thankful for how fast you guys always respond when the ao3 website goes down. I was wondering what's the circus like behind the scenes when it happens? xD Do you usually first notice when we start panicking, or does someone keep an eye on it 24/7, do emails start flying from social team to it, is it usually scary or is it very organised and calm since you're so experienced, who makes the decision to pull the plug for a few hours if it's really bad and looks hopeless, stuff like this. Thank you! Committee answer: Accessibility, Design, & Technology (AD&T) and Systems (our two main technical committees) have already given their own replies to this, but from Comms’ end, we often are the ones that handle posting and disseminating information for downtimes! We work hand in hand with AD&T and Systems to ensure that we're distributing the most accurate and concise information to the public, and coordinate with our fellow volunteers to make sure that it’s sent out in time. We do our best to handle the public logistics so that our coders can focus on their own work!
General Questions
How many hours a week do you spend on your OTW volunteer work?
It truly depends on the week! Typically I would say ~4 hours, for just keeping on top of things and my weekly tasks. It can be upwards of 10 if there's things outside of the norm or that require a bit of research. (Caitlynne)
For me, it depends on the time of year most of all! As an Event Coordinator, half of the year I'd say it's ~2-6 hours a week. The bulk of our anniversaries and holidays converge into fall and winter, during that time it's more ~6-8 hours. (Elin)
How do you manage your volunteer time, and do you do the same thing every day like with a day job?
I hop on my computer pretty frequently throughout the week, so I tailor my OTW time to when I'm on my PC. If there's a day I'm busy and away from my PC, I know I'll have to "catch up" the next day when I have time, so to speak. (Tiana)
I try to check our chat tool/the Comms email when I can throughout the day and give a dedicated half hour or so on my laptop in the evenings. It doesn't always work out, but that's the goal! (callmeri)
What's your favorite part about volunteering at the OTW?
I like that tending the little OTW!Tumblr corner of the landscape helps the whole fandom ecosystem. (Remi)
The best part of volunteering at the OTW is the people, for sure! The social aspect is easily what motivates me the most to stay. I have made lots of friends and the Communications committee has been a really supportive environment! (stork)
What's the aspect of volunteer work with the OTW that you most wish more people knew about?
We are fans just like you! There are so many different cultures and fandoms coming together every day to make the organisation run. (Tal)
We are really big on emojis! The custom emoji feature on our chat tool is definitely getting a lot of mileage with us XD. Also, you can put OTW work on your resume if you want to. (stork)
What does a typical day as an OTW volunteer looks like for you?
Check the Tumblr notes and ask box in the morning, before scrolling through my personal dash and then the tags the organisation follows looking for Things To Queue. Mosey through the #ao3 tag on occasion to reply or leave little notes to folks. Every day is similar, but none are The Same. (Remi)
I often start by checking and responding to messages from other volunteers, and then make a list of current tasks to work on. Sometimes that means brainstorming activities for a special milestone, other times it's writing posts, or preparing for an event. (Elin)
What is your favorite animal? Alternatively, do you have a favorite breed of cat/dog?
I love bats and think they're super cute, but identify with possums on an emotional level. (Caitlynne)
My favorite animal is a saiga antelope. Fave dog breed: Irish wolfhound. (Communications volunteer)
Do you enjoy reading fanfic? If so, what's your favorite work on AO3?
For a dyslexic person I seem to read A LOT of fanfic... I actually tend to read more on AO3 than actual books?? Anyway, my favourite of all time would have to be unholyverse. I don't think anything can beat that… (Gray)
I love reading fic so much it's kind of concerning how many tabs I have open all the time. My favourite fic is locked but another fave is between the sheets by DasWarSchonKaputt. og. goat. mother. (choux)
Do you write any fanfic yourself? What do you enjoy about it?
I do write. I enjoy the creativity and the ability to explore characters. (Communications volunteer)
I do! It's my favorite hobby and one I neglected a bit last year. I hope to get back into the swing of it in 2026. (Tiana)
What fandoms are you (currently) in?
I’m very active in the Dan and Phil fandom :3 (Gray)
Mostly MDZS and IWTV for the past few years, but Heated Rivalry took over my brain so it looks like I'm getting on that ride. (callmeri)
Do you feel glad or proud to see fanfiction in your mother tongue?
I'm also a tag wrangler, so I get to participate in tag translation (every tag wrangled needs to have a documented english translation). There aren't as many German works, but we have loads of German volunteers – this means there's often several of us running to translate whenever there's a German tag. it's really cool to see very specific cultural references in works! (Tal)
I read a TON of socmed AUs in Filipino along with the Filipino fics in general! I'm super happy to see fanwork in Filipino and when a creator is Filipino as well! especially when I see actual locations or cultural tidbits getting referenced. (choux)
Thanks so much to every volunteer who took the time to answer!
(For more answers, check out this work on AO3, where we collect additional replies to each question!)
The Organization for Transformative Works is the non-profit parent organization of multiple projects including Archive of Our Own, Fanlore, Open Doors, OTW Legal Advocacy, and Transformative Works and Cultures. We are a fan-run, donor-supported organization staffed by volunteers. Find out more about us on our website.
Visualizing Perseverance’s AI-Planned Drive on Mars
PIA26646
Credits: NASA/JPL-Caltech
Downloads
Visualizing Perseverance’s AI-Planned Drive on Mars
PNG (326.26 KB)
PIA26646 Animation
MP4 (157.38 MB)
Description
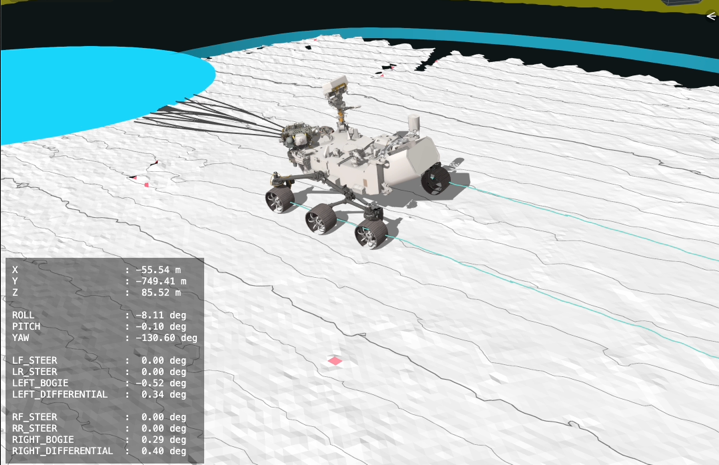
This animation of NASA’s Perseverance was created with the Caspian visualization tool using data acquired during an 807-foot (246-meter) drive on the rim of Jezero Crater made by the rover on Dec. 10, 2025, the 1,709th Martian day, or sol, of the mission. The mission’s “drivers,” or rover planners, use the information to understand the Perseverance’s autonomous decision-making process during its drive by showing why it chose one specific path over other options.
This was one of two drives, the first being on Dec. 8, in which generative artificial intelligence provided the route planning. The AI analyzed high-resolution orbital imagery from the HiRISE (High Resolution Imaging Science Experiment) camera aboard NASA’s Mars Reconnaissance Orbiter and terrain-slope data from digital elevation models to identify critical terrain features — bedrock, outcrops, hazardous boulder fields, sand ripples, and the like. From that analysis, it generated a continuous path complete with waypoints, fixed locations where the rover takes up a new set of instructions.
The pale blue lines depict the track the rover’s wheels take. The black lines snaking out in front of the rover depict the different path options the rover is considering moment to moment. The white terrain Perseverance drives onto in the animation is a height map generated using data the rover collected during the drive. The pale blue circle that appears in front of the rover near the end of the animation is a waypoint.
NASA’s Jet Propulsion Laboratory, which is managed for the agency by Caltech, built and manages operations of the Perseverance rover.
Video: Perseverance Rover’s View of Crater Rim Drive
PIA26647
Credits: NASA/JPL-Caltech
Downloads
Video: Perseverance Rover’s View of Crater Rim Drive
JPEG (659.02 KB)
PIA26647 Animation
MP4 (125.55 MB)
Description
This animation shows Perseverance’s point of view during drive of 807 feet (246 meters) along the rim of Jezero Crater on Dec. 10, 2025, the 1,709th Martian day, or sol, of the mission. Captured over two hours and 35 minutes, 53 Navigation Camera (Navcam) image pairs were combined with rover data on orientation, wheel speed, and steering angle, as well as data from Perseverance’s Inertial Measurement Unit, and placed into a 3D virtual environment. The result is this reconstruction with virtual frames inserted about every 4 inches (0.1 meters) of drive progress.
NASA’s Jet Propulsion Laboratory, which is managed for the agency by Caltech, built and manages operations of the Perseverance rover.
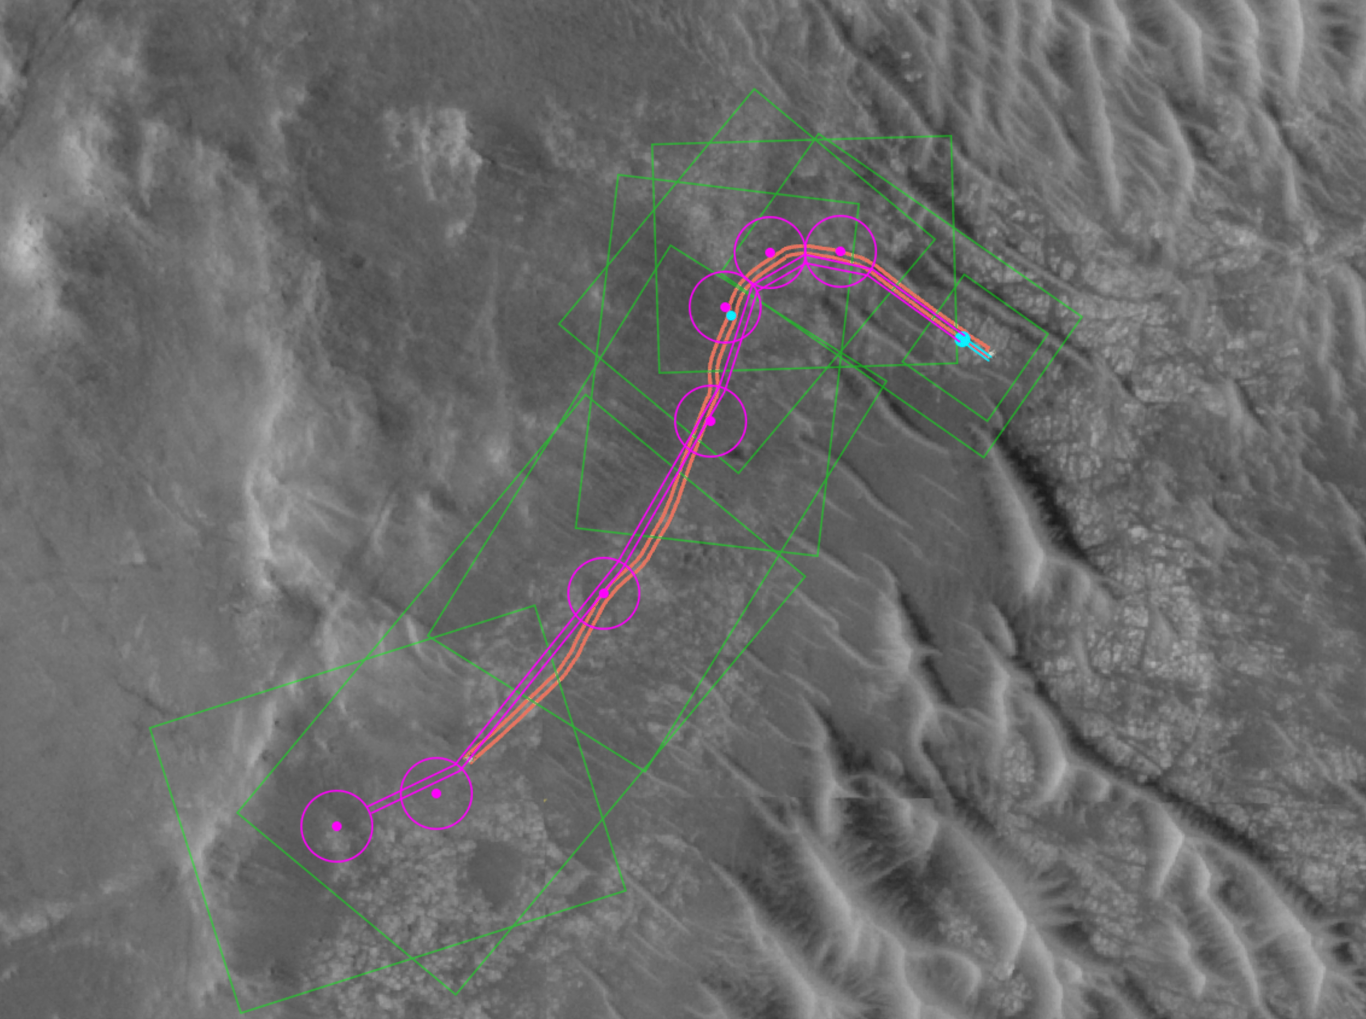
This annotated image from NASA’s HiRISE (High Resolution Imaging Science Experiment) camera aboard the agency’s Mars Reconnaissance Orbiter image depicts the AI-planned route and the actual route taken by NASA’s Perseverance Mars rover during its 807-foot (246-meter) drive on Dec. 10, 2025, the 1,709th Martian day, or sol, of the mission. The drive was the second of two demonstrations — the first being on Dec. 8 — showing that generative artificial intelligence could be incorporated in the rover’s route planning.
The magenta lines depict the path the rover’s wheels would take if it were to follow AI-processed waypoints, which are indicated with the magenta circles. (Waypoints are fixed locations where the rover takes up a new set of instructions.) The orange lines are based on data downlinked after the drive was complete and depict the actual path the rover took. The short, bold segments of the blue lines at the start of the route, in the upper right, show the portion of the drive that was determined by the mission’s rover drivers and based on imagery taken by the rover of the surface ahead. The surface areas in pale green boxes are called “keep-in zones.” Perseverance’s self-driving software is only allowed to pick routes inside those zones.
The graphic was generated using Hyperdrive, part of the software suite used to plan rover drives and manage the massive influx of engineering data from the Perseverance rover.
NASA’s Jet Propulsion Laboratory, which is managed for the agency by Caltech, built and manages operations of the Perseverance rover.
The University of Arizona in Tucson, operates HiRISE, which was built by BAE Systems in Boulder, Colorado. JPL manages the Mars Reconnaissance Orbiter for SMD.
U.S.-India NISAR Satellite Images Mississippi River Delta Region
PIA26620
Credits: NASA/JPL-Caltech
Downloads
U.S.-India NISAR Satellite Images Mississippi River Delta Region
PNG (80.09 MB)
PIA26620 Figure A
JPEG (440.47 MB)
Description
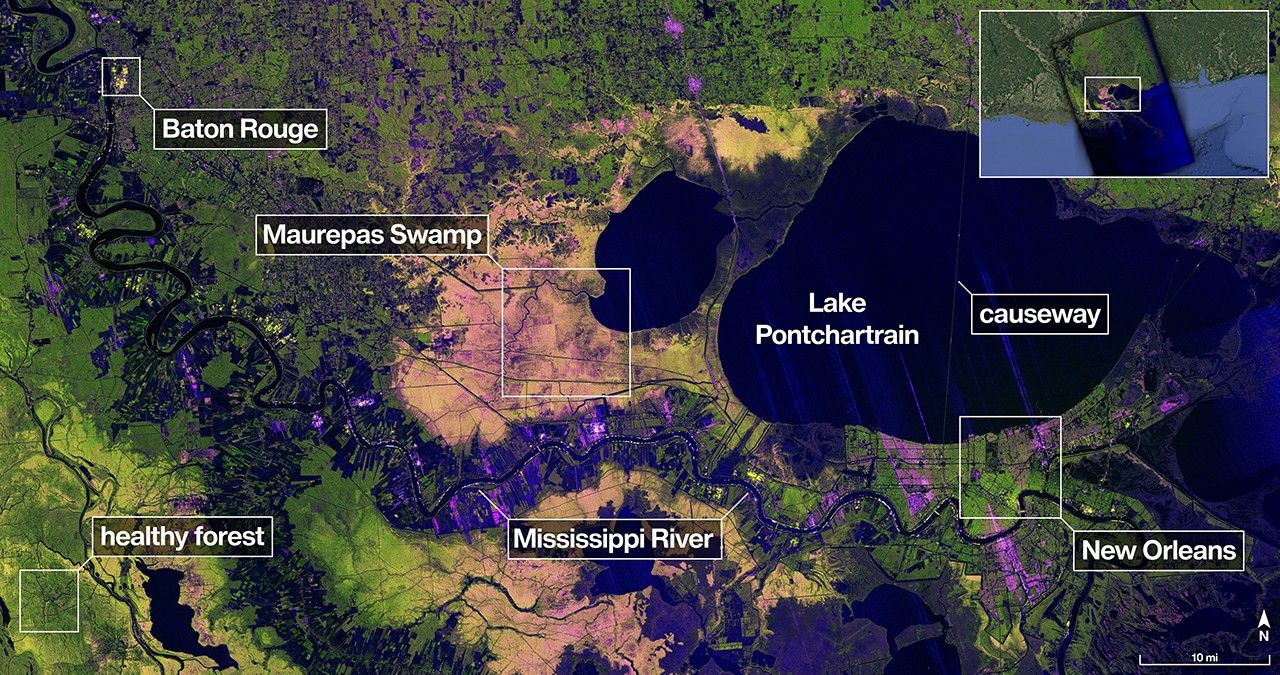
The NISAR (NASA-ISRO Synthetic Aperture Radar) Earth-observing satellite’s L-band synthetic aperture radar (SAR) instrument captured this image of the Mississippi River Delta region in southeastern Louisiana on Nov. 29, 2025.
The colors in the image represent varying types of cover, which tend to reflect microwaves from the radar differently. Portions of New Orleans appear green, a sign that the radar’s signals may be scattering from buildings that are oriented at different angles relative to the satellite’s orbit. Parts of the city appear magenta where streets that run parallel to the satellite’s flight track cause the signals to bounce strongly and brightly off buildings and back to the instrument.
The resolution of the image is fine enough to make clear, right of center, the Lake Pontchartrain Causeway — twin bridges that, at nearly 24 miles (39 kilometers) in length, make up the world’s longest continuous bridge over water.
The bright green areas to the west of the Mississippi River, which snakes from Baton Rouge in the upper left to New Orleans in the lower right, are healthy forests. There, tree canopies and other vegetation are causing NISAR’s microwaves to bounce in numerous directions before returning to the satellite. Meanwhile, the yellow-and-magenta-speckled hues of Maurepas Swamp, directly west of Lake Pontchartrain and the smaller Lake Maurepas, indicate that the tree populations in that wetland forest ecosystem have thinned.
On either bank of the Mississippi, the image shows parcels of varying shapes, sizes, and cover. Darker areas suggest fallow farm plots, while bright magenta indicates that tall plants, such as crops, may be present.
Figure A
Figure A is a version of the same image with labels, locator inset, scale, or compass.
The L-band system uses a 9-inch (24-centimeter) wavelength that enables its signal to penetrate forest canopies and measure soil moisture as well as motion of ice surfaces and land down to fractions of an inch — the latter information being key to understanding how the land surface moves before, during, and after earthquakes, volcanic eruptions, and landslides.
The S-band radar, provided by the Indian Space Research Organisation’s Space Applications Centre, uses a 4-inch (10-centimeter) microwave signal that’s more sensitive to small vegetation, which makes it effective at monitoring certain types of agriculture and grassland ecosystems.
Launched in July 2025, NISAR is collecting data that will benefit humanity by helping researchers around the world better understand changes in our planet’s surface, including its ice sheets, glaciers, and sea ice. It also will capture changes in forest and wetland ecosystems and track movement and deformation of our planet’s crust by phenomena such as earthquakes, landslides, and volcanic activity. The global and rapid coverage from NISAR will provide unprecedented support for disaster response, producing data to assist in mitigating and assessing damage, with observations before and after catastrophic events available in short time frames.
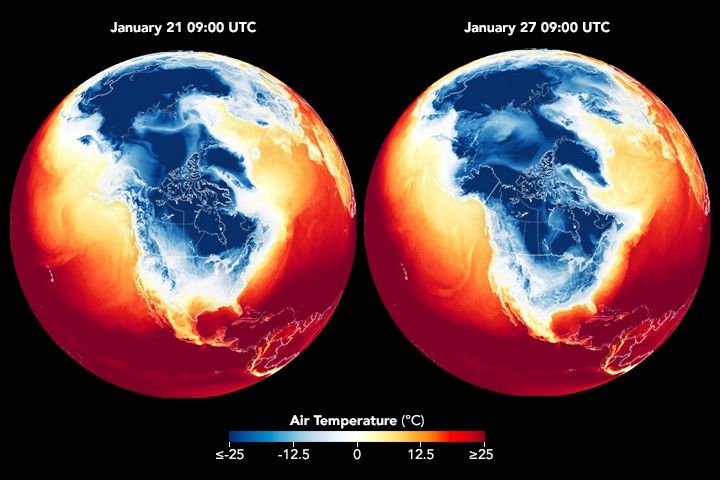
In the wake of a winter storm that blanketed numerous U.S. states with snow and ice, unusually low temperatures continued to grip a large swath of the nation east of the Rockies in late January 2026. The cold spell was notable for severity, longevity, and geographic scope.
This animation depicts surface air temperatures across part of the Northern Hemisphere, including North America, from January 21 to 29. It combines satellite observations with temperatures calculated by a version of the Goddard Earth Observing System (GEOS) global model, which uses mathematical equations to simulate physical processes in the atmosphere.
Dark blue areas indicate the lowest surface air temperatures. The brief pulses show daily warming and cooling, while the broader pattern reveals cold air spreading south and east and lingering through much of the week.
According to the National Weather Service (NWS), the surge of Arctic air pushed deep into the United States on January 22, ushering in a period of low temperatures and harsh wind chills. The cold coincided with a jet of moisture to produce significant accumulations of snow and ice spanning from the U.S. Southwest to New England.
In the days after the storm, dangerously cold weather persisted. In the Midwest, for example, the temperature in Alliance, Nebraska, dropped to minus 26 degrees Fahrenheit (minus 32 degrees Celsius) on January 24, the lowest daily minimum temperature for that date on record, according to preliminary NWS reports. In the South, an extreme cold warning was in effect in south-central Texas overnight on January 26, with temperatures dipping into the single digits. By January 27, parts of the South had started to see slight warming, but wind chills down to -20°F (-29°C) continued across the Midwest and Northeast.
According to meteorologists, the cold snap was caused by frigid air from the Canadian and Siberian Arctic funneling into eastern North America, then being driven south as high-pressure systems forced the jet stream to dip. Forecasts called for another blast of Arctic air late in the week, with below-normal temperatures persisting into early February.
The lingering cold has posed extra challenges to those who remained without power or heat after the storm and for those working to clean up, clear streets, and restore power and transportation services.
NASA’s Disasters Response Coordination System has been activated to support agencies responding to the winter storm. The team will be posting maps and data products on its open-access mapping portal as new information becomes available.
NASA Earth Observatory images and animation by Lauren Dauphin, using GEOS data from the Global Modeling and Assimilation Office at NASA GSFC. Story by Kathryn Hansen.
Ammonia-Bearing Compounds Discovered at Surface of Jupiter’s Moon Europa
PIA26546
Credits: NASA/JPL-Caltech
Downloads
Ammonia-Bearing Compounds Discovered at Surface of Jupiter’s Moon Europa
PNG (4.09 MB)
Description
Advanced analysis of decades-old data from NASA’s Galileo spacecraft identifies ammonia-bearing compounds discovered on the surface of Jupiter’s moon Europa, as shown in this composite image. Zooming in on an area about 250 miles (about 400 kilometers) wide, the black-and-white mosaic to the right is composed of multiple images from Galileo’s Solid-State Imaging camera. Overlaid are representations of data from the spacecraft’s Near-Infrared Mapping Spectrometer (NIMS) instrument: Red pixels mark locations where ammonia-bearing compounds were detected; purple pixels indicate no detections of the compounds. The NIMS data was captured during Galileo’s 11th orbit of Jupiter in 1997.
Dark, crisscrossing bands in the underlying image represent fracturing of Europa’s icy surface. Detection of ammonia-bearing compounds near such features could indicate that they were actively placed there by cryo-volcanic processes bringing liquid water up from Europa’s vast subsurface ocean.
Launched in 1989 and managed by the agency’s Jet Propulsion Laboratory in Southern California, NASA’s Galileo mission concluded its extended mission to the Jupiter system in September 2003. Caltech manages JPL for NASA.
NASA Analysis Shows La Niña Limited Sea Level Rise in 2025
PIA26619
Credits: NASA/JPL-Caltech
Downloads
NASA Analysis Shows La Niña Limited Sea Level Rise in 2025
PNG (2.39 MB)
Description
This graph shows the rise in global mean sea level from 1993 to 2025 based on data from a series of five international satellites. The solid red line indicates the trajectory of this increase, which has more than doubled over the three decades. The dotted red line projects future sea level rise.
A NASA analysis found that the average height of Earth’s oceans increased by 0.03 inches (0.08 centimeters) in 2025, a rate of increase that was lower than the 0.23 inches (0.59 centimeters) seen in 2024. It was also below the long-term expected rate of 0.17 inches (0.44 centimeters) per year based on the rate of rise since the early 1990s.
Though sea levels have increasingly trended upward, years during which the rise in the average height was less usually have occurred during La Niñas — the part of the El Niño-Southern Oscillation cycle that cools the eastern Pacific Ocean, often leading to heavy rainfall over the equatorial portions of South America.
The La Niña that started in 2025 and has extended into early 2026 has been relatively mild. Even so, the extra precipitation it has poured on the Amazon River basin contributed to an overall shift of water from ocean to land. This effect tends to temporarily lower sea levels, offsetting the rise caused by melting glaciers and ice sheets and warming of the oceans, which raises the sea levels through the expansion of water when the temperature increases. The net result in 2025 was a lower-than-average sea level rise. Faster-rising sea levels are likely to resume as the extra water in the Amazon basin makes its way to the oceans.
This artist’s concept depicts a cutaway view showing Europa’s ice shell. It contains a shallow layer of small imperfections (cracks, pores, and voids) that extend down from the surface hundreds of feet. The icy moon of Jupiter is thought to harbor an ocean below its frozen exterior.
Data used to generate a new result on the ice thickness and structure was collected by the microwave radiometer instrument on NASA’s Juno spacecraft during a close flyby of the icy moon on Sept. 29, 2022.